News
Kiel Trade Indicator 02/22: Ukraine war significantly burdens international trade
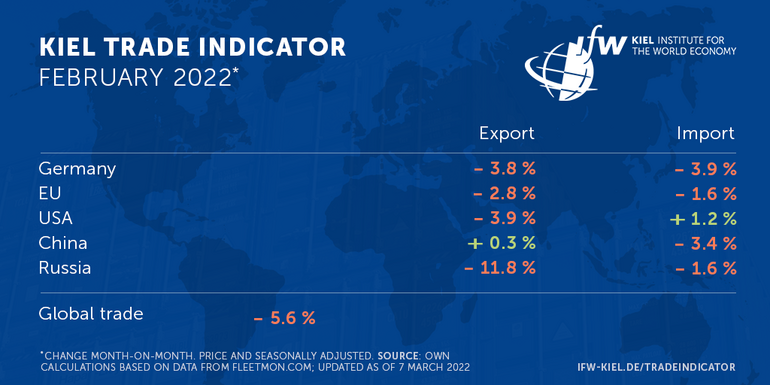
According to the latest data update of the Kiel Trade Indicator for February, world trade is expected to decline significantly by 5.6 percent compared with the previous month (price and seasonally adjusted). This is the biggest slump since the outbreak of the COVID-19 crisis in spring 2020, abruptly interrupting the recovery trend of recent months.
"Although the conflict between Russia and the Ukraine only escalated in the last week of February, uncertainty, sanctions, and increased goods inspections to comply with sanctions already appear to impact trade around the globe. Already in mid-February ship movements indicated weak trade in February, sanctions against Russia have reinforced this negative trend," said Vincent Stamer, head of the Kiel Trade Indicator.
For almost all economies, the signs of the Kiel Trade Indicator for February trade are negative. In Germany, imports are expected to fall unusually sharply compared with January (-3.9 percent), and exports are also likely to decline (-3.8 percent). The indicator also points to negative values for EU imports (-1.6 percent) and exports (-2.8 percent).
In the US, ship movements indicate lowerexports (-3.9 percent) and slightly positive imports (+1.2 percent). The reverse is true in China, where values are minimally positive (+0.3 percent) for exports, while negative (-3.4 percent) for imports. Still the omicron variant could weigh on China's trade.
For Russia itself, the Kiel Trade Indicator shows a sharp drop in exports of 11.8 percent compared with January. In the port of St. Petersburg alone, 17 percent fewer goods were shipped in February. Shipments out of Russia’s largest container port were comparatively low during the entire month, sanctions have likely put pressure on them towards the end of the month. Russian imports, on the other hand, are expected to show only a modest decline of 1.6 percent.
"The situation in Russian trade is complex, but it seems that the sanctions imposed by the West are having an effect. Russian exporters are likely to withhold more goods simply because of uncertainty about payment. Although major shipping companies have announced a halt to their deliveries to Russia, this only affects new bookings. Currently old bookings will still be shipped to Russia as planned, provided they do not violate sanctions," says Stamer.
In the Kiel Trade Indicator, the Ukraine isonly included in the group of other members of the Commonwealth of Independent States (CIS) excluding Russia. This group shows a negative value for exports (-4 percent) and a positive value for imports (+2.3 percent).
However, position data from container ships show that the Ukraine is largely cut off from international maritime trade. No large container ship has called at the country's most important port, Odessa on the Black Sea, since the outbreak of war.
"The February figures give a taste of the economic consequences of the Ukraine war. In the coming months, trade in goods between the EU and Russia is likely to be significantly reduced due to sanctions, uncertainty but also voluntary restrictions by companies and the population," Stamer said. "Increased customs controls to check compliance with sanctions against Russia may additionally lead to delays in maritime trade."
For more information on the Kiel Trade Indicator and forecasts for 75 countries and regions, visit www.ifw-kiel.de/tradeindicator.
The next updates of the Kiel Trade Indicator will be on March 22 (without media information) and on April 6 (with media information for trade in March 2022).

About the Kiel Trade Indicator
The Kiel Trade Indicator estimates trade flows (imports and exports) of 75 countries and regions worldwide, the EU and world trade as a whole. Specifically, the estimates cover over 50 individual countries as well as regions such as the EU, sub-Saharan Africa, North Africa, the Middle East or emerging Asia. It is based on the evaluation of ship movement data in real time. An algorithm programmed at the Kiel Institute uses artificial intelligence to analyze the data and translates the ship movements into real, seasonally adjusted growth figures compared with the previous month.
We update the data twice a month. Around the 20th (without press release) for the current and the following month and around the 5th (with press release) for the previous and the current month.
Arriving and departing ships are recorded for 500 ports worldwide. In addition, ship movements in 100 maritime regions are analyzed and the effective utilization of container ships is derived from draught information. Country-port correlations can be used to generate forecasts, even for countries without their own deep-sea ports.
Compared to previous leading trade indicators, the Kiel Trade Indicator is available much earlier, is much more comprehensive, relies on a uniquely large database using big data, and has a low statistical error by comparison. The algorithm of the Kiel Trade Indicator uses machine learning, so that the quality of the forecast continues to improve over time.